
Optimal transport · graphs · time series
The mathematics of moving piles of sand.
A probability distribution is a pile of sand with unit mass. Optimal transport asks how to move one pile onto another as cheaply as possible, and the answer turns out to be a geometry. This site collects research that puts that geometry to work: finding structure in time series, and averaging and decomposing distributions that live on graphs.
Looking for research or applied ML roles — available now.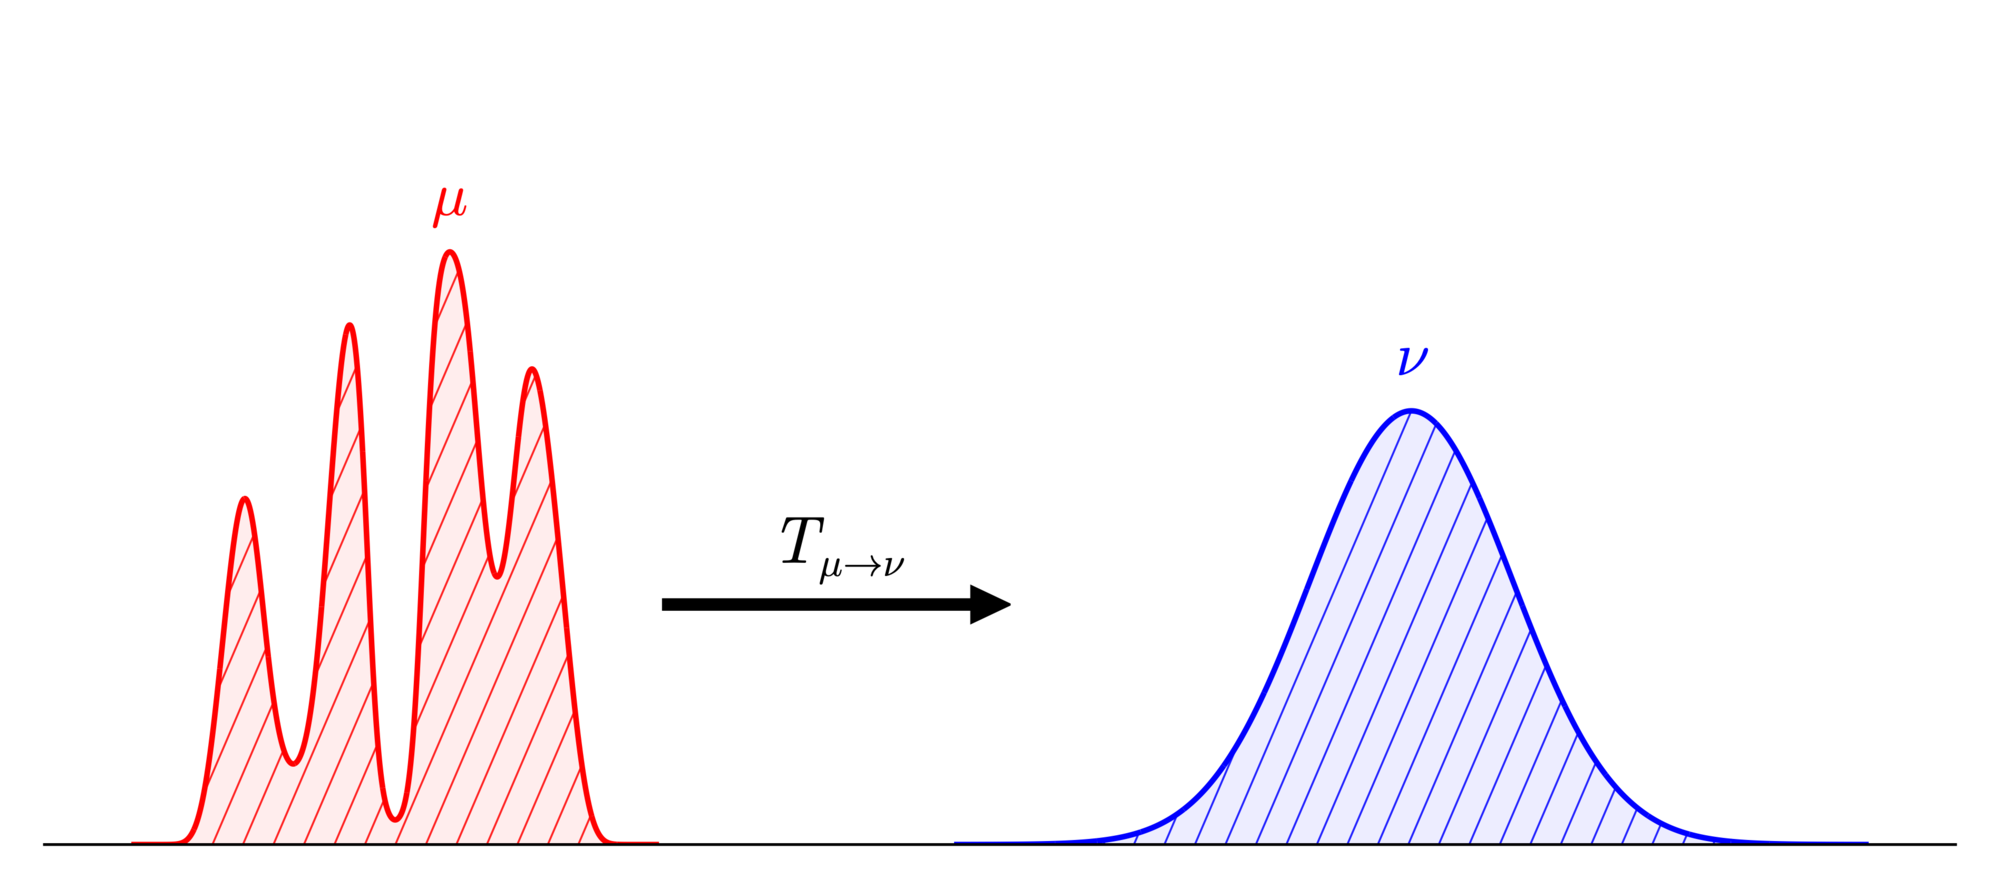
Try it: barycentric coding on a graph
λ = (, , )
Linear mixture Σ λiνi
spread
Transport barycenter νλ
spread
Circle area is proportional to mass, on the same scale in both graphs. Spread is the root-mean-square distance of the mass from its own center, measured in grid steps.
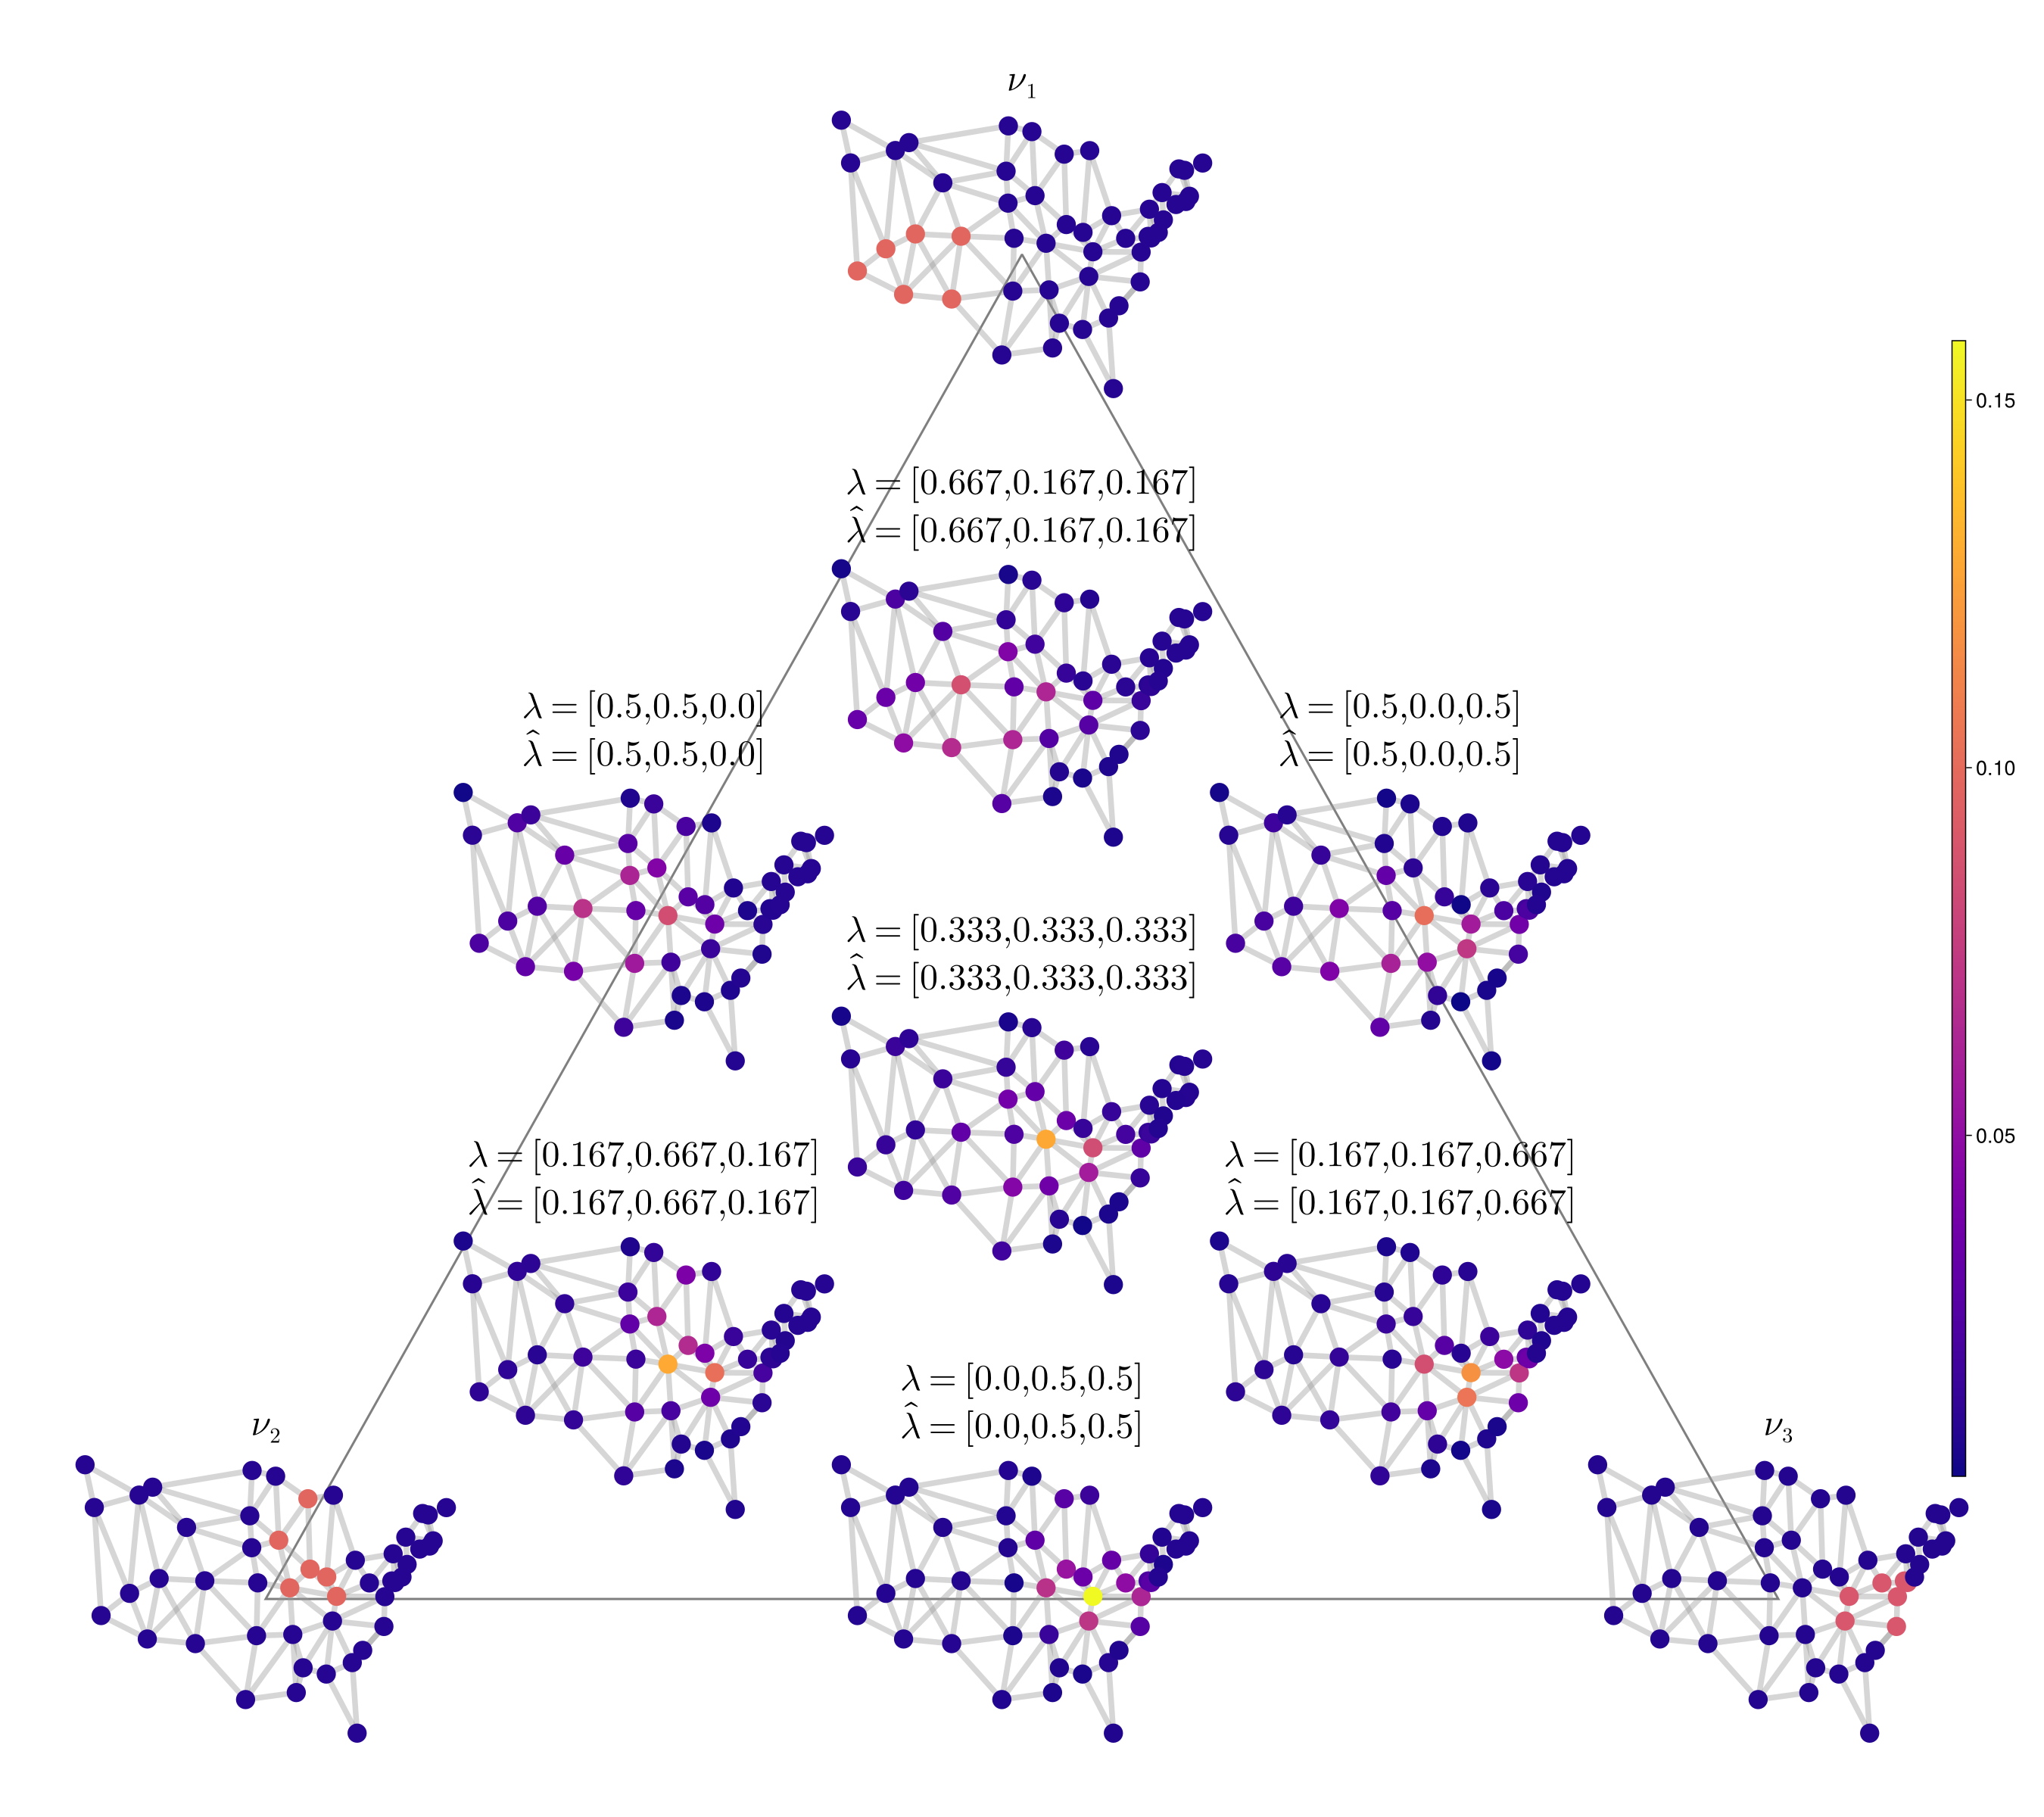
An interactive demo highlighting the geometry of barycentric coding of measures on graphs.
 Talk · slides in your browser
A Barycentric Coding Model for Measures on Graphs
FSU Topology & Geometry Seminar
 Papers & code
Preprints and open-source packages
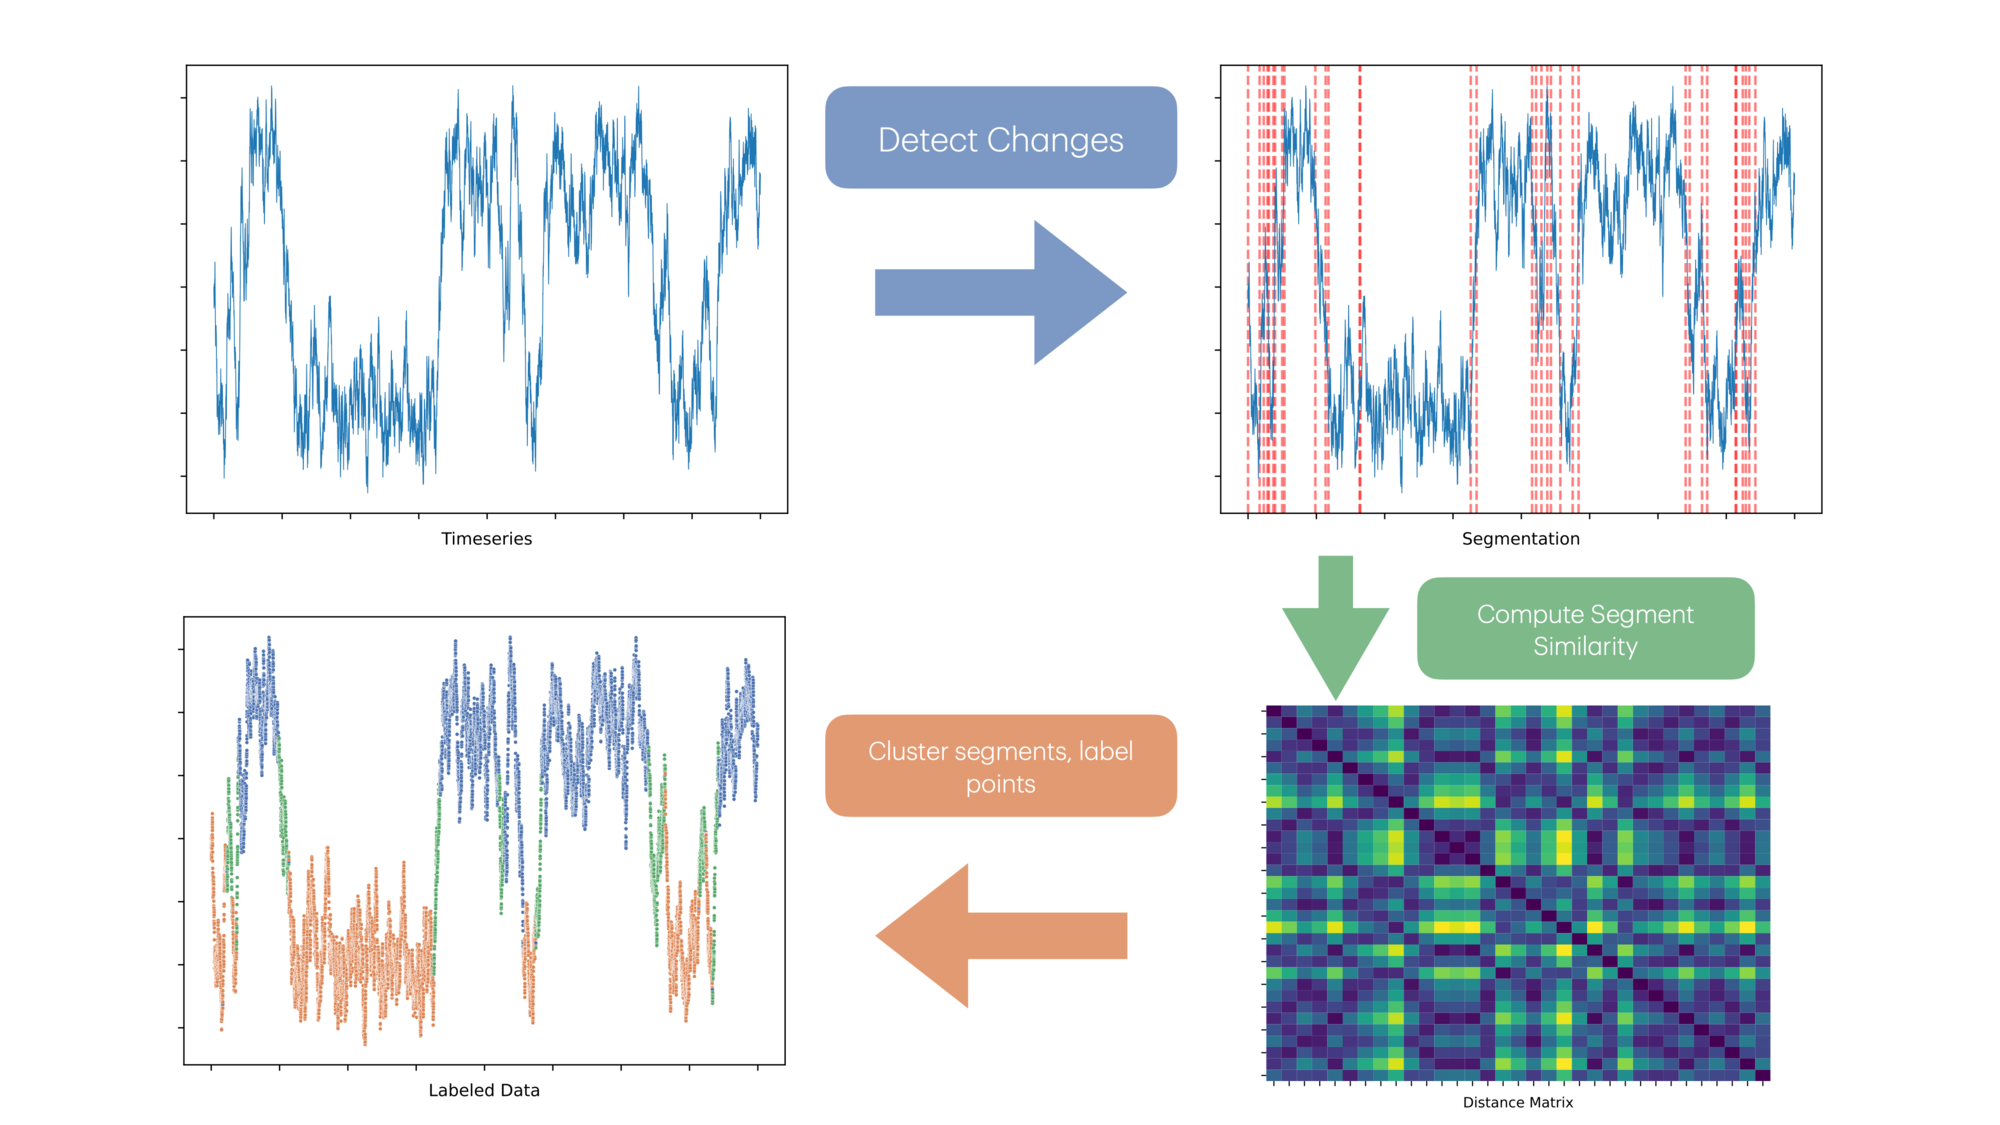
Change point detection for time series, and barycenters of measures on graphs.
Latest posts
-
claude-agents, & How I'm Using LLMs inside of Emacs as of Fall 2026
2026-10-01
Using Claude Code, I'm building a little agent management tool for Emacs that allows me to better manage atomic tasks on a project-by-project basis.
-
Posts I Intend to Write
2026-09-21
What do you need to know to push around piles of sand on discrete metric spaces, anyways?
-
What is this place?
2026-09-18
Nice to meet you too.